Prediction of Range and Energy Consumption
USE-CASE
The driving range of a Battery Electric Vehicle (BEV) depends both on the available battery capacity and on the energy consumption of the vehicle. This energy consumption is not constant. Even if the available battery capacity is exactly known, the driving range of the vehicle can vary.
As can be seen in Figure 1, approximately one quarter of the energy consumption of an electric city bus is spent on auxiliaries: mainly heating, ventilation and air conditioning, while three quarters are used for driving the vehicle (transmission, tires, brakes and aerodynamics). To better predict the range of a BEV, an algorithm is developed that predicts the energy consumption.
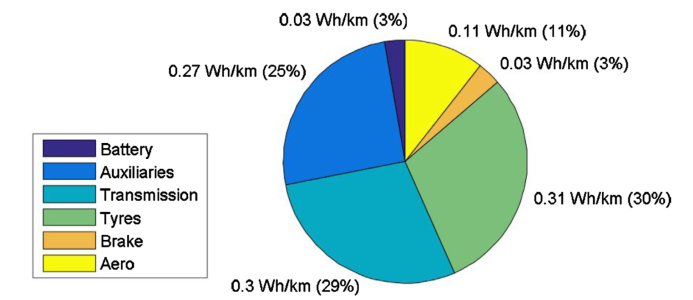
Figure 1: Distribution of the energy losses of an electric city bus on a city route [1].[/caption]
ENERGY CONSUMPTION PREDICTION ALGORITHM
The predictor work is in two steps:
- Predict the future velocity profile of the vehicle,
- Calculate the energy required to drive this velocity profile
Additional to supplying the driver with accurate range information, the energy consumption prediction has multiple applications, such as:
- Enabling onboard energy management by knowing the future power request
- Enabling more dynamic scheduling for public transport vehicle
TECHNOLOGY DEMONSTRATED
The predictor has been evaluated with both demonstrators of the EVERLASTING project. For D7.4, the Voltia eVan, a detailed version of the prediction tool is coded in MATLAB [2]. The tool considers up-to-date weather conditions, road slope, and route information and can be used to predict the energy consumption of an arbitrary route [2], [3]. This version works offline; it can be used to predict the energy required for a trip before departure.
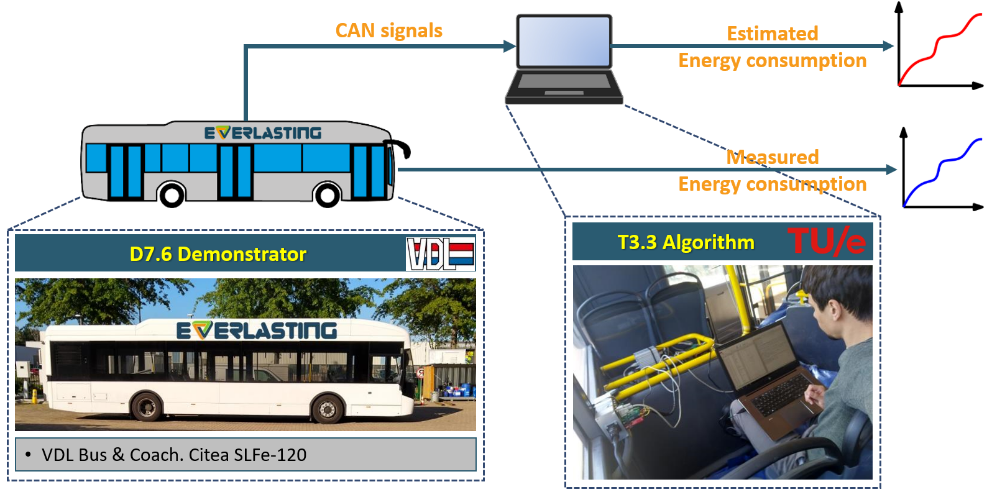
Secondly, an online version of the predictor is implemented on-board the D7.6 VDL city bus demonstrator [4]. This more basic and computationally efficient version is implemented via Vector CANoe and directly reads information from the vehicle CAN-bus. This online tool continuously predicts the energy required to finish the current trip.
DEMONSTRATOR: VOLTIA E-VAN.
To demonstrate the capabilities of a high-fidelity model that predicts the energy consumption prior to a trip, the TU/e MECPRO software has been developed [5]. This model uses data from free online data services, such as OpenStreetMap, and OpenWeatherMap, together with results from vehicle measurements, such as dynamometer tests and coast-down tests.
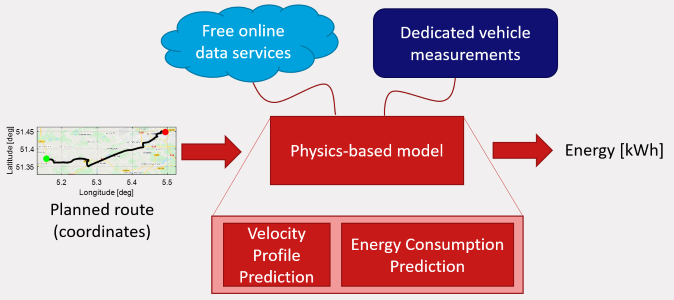
Figure 2: Overview of the TU/e MECPRO algorithm.
VELOCITY PROFILE PREDICTION
Given the route of the vehicle, the velocity profile is predicted based on the following information:
- Maximum legislated velocity -> Determines max. velocity
- Corner radius -> Determines max. velocity in corners
- Traffic light locations -> Determines stop locations
- Driver model -> Determines acceleration/deceleration + max. velocity offset.
Information 1., 2. and 3. are taken directly from OpenStreetMap [6], whereas information 4. is based on previously measured data of the same driver. An example of the resulting velocity profile is shown in Figure 3.
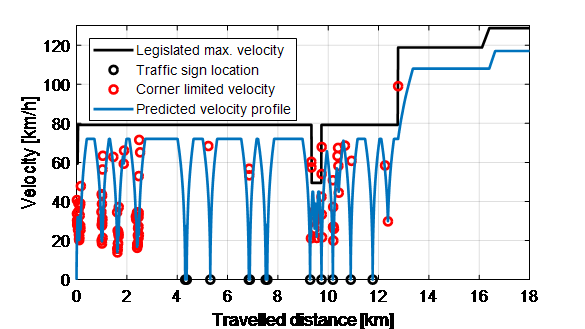
Figure 3: Predicted velocity profile including the pieces of information that dictate its shape.
ENERGY CONSUMPTION PREDICTION
The energy consumption of the vehicle is modeled using a physics-based approach, i.e. by modeling the longitudinal dynamics of the vehicle, as illustrated by Figure 4.
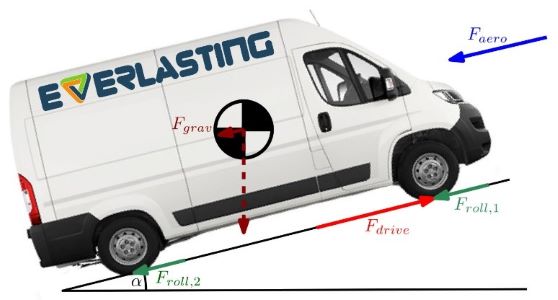
Figure 4: Schematic side view of the Voltia eVan with all longitudinal forces indicated by arrows.
The battery power can be calculated according to:
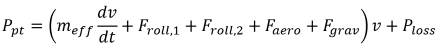
Both free online data services and dedicated vehicle measurements are used to determine the forces. For instance, the route slope profile determines the gravity-component , and is based on an online elevation map [7]. Up-to-date air density and ambient temperature information, taken from OpenWeatherMap [8], are used for to calculate the aerodynamic drag force . The powertrain losses where measured on a dynamometer at the TU Eindhoven, as shown in Figure 5. and this video:
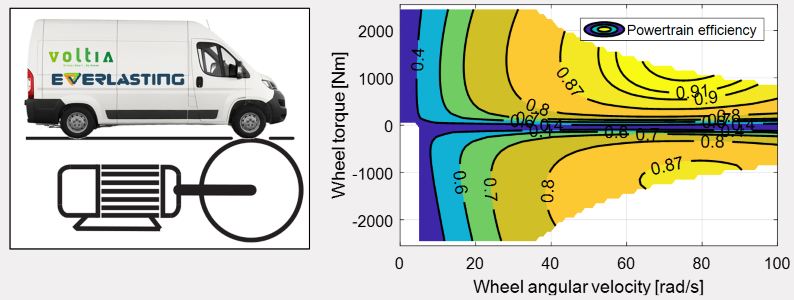
Figure 5: Exemplary results of the powertrain losses as measured on a dynamometer.
Based on five trips with an average length of 17.6 km, the tool is fairly accurate and stays mostly below 10% with respect to the measured energy consumption [2]. This shows that the algorithm is successful in predicting the energy consumption for a new trip.
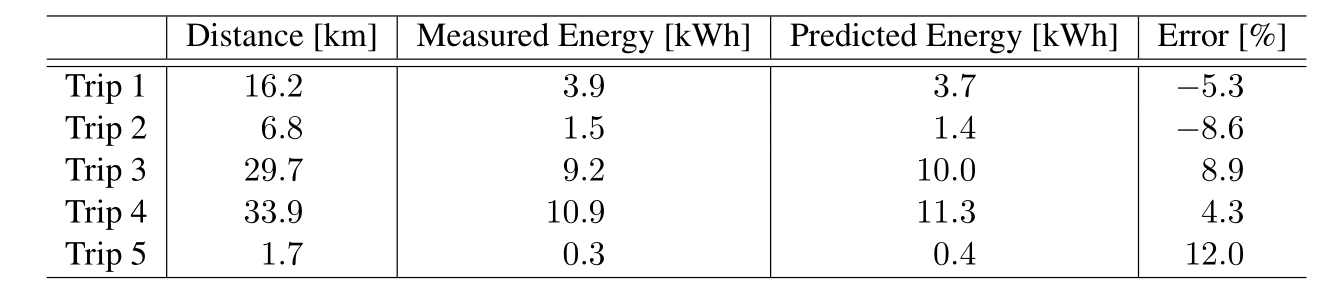 Table 1: Results of TU/e MECPRO for 5 different trips driven with the Voltia eVAN Demonstrator.
DEMONSTRATOR: VDL CITY BUS
The aim is to predict the remaining energy consumption of the D7.6 electric city bus demonstrator, given its current position on the route and available knowledge of the remainder of the route, while driving. This allows to determine the battery state of charge at the end of the trip. This information can be used for the charging strategy.
VALIDATION AND RESULTS
The technology is validated by driving the D7.6 Demonstrator along a predefined route. While driving, the prediction of the remaining velocity profile is continuously updated based on:
- The current position and velocity
- Future maximum legislated velocity
- Future road curvature (i.e. corners)
- Future bus stop locations
The prediction horizon is equal to the remaining distance of the trip. An exemplary result of a predicted velocity profile is visible in Figure 6(left).
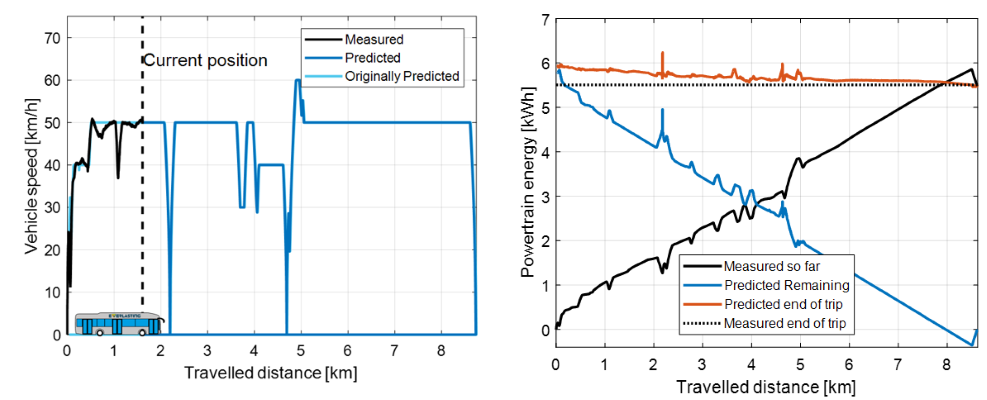 Figure 6: (left) Velocity profile of the vehicle as predicted when the vehicle was at 1.6 km. (right) Measured, predicted, and trip energy as continuously calculated during the trip.
Using the remaining velocity profile prediction as input to the physics-based model of the longitudinal vehicle dynamics, an energy consumption predicted for the remaining part of the trip (‘Predicted Remaining’ in Figure 6). Together with the measured energy consumption (‘Measured so far’) enough information is available to determine total amount of energy required for the trip (‘Predicted end of trip’), as shown in Figure 6(right). At any point along the trip, this prediction can be compared to the actual consumed energy for the entire trip (dashed line in Figure 6(right)). In this comparison, the difference towards the end of the trip is weighted less, because it gets progressively easier to make predictions as the travelled distance increases. The resulting weighted-average error is found to be 3.1%, based on 6 observed trips of the same route [4]. Below an animation showing the working of this algorithm.
REFERENCES
[1] J. Vepsäläinen, K. Kivekäs, K. Otto, A. Lajunen, and K. Tammi, “Development and validation of energy demand uncertainty model for electric city buses,” Transp. Res. Part D Transp. Environ., vol. 63, pp. 347–361, Aug. 2018.
[2] C. J. J. Beckers, M. Paroha, I. J. M. Besselink, and H. Nijmeijer, “A Microscopic Energy Consumption Prediction Tool for Fully Electric Delivery Vans,” in 33rd World Electric Vehicle Symposium & Exposition (EVS33) Peer Reviewed Conference Papers, 2020. DOI: https://dx.doi.org/10.5281/zenodo.4023302
[3] C. J. J. Beckers, I. J. M. Besselink, and H. Nijmeijer, “D3.3 Report on power request prediction for electric vehicles,” Feb. 2020.
[4] J. Flores-Paredes and A. Hol, “D7.6 Report on upgrade of existing test vehicle, the test program and range extension results (Confidential),” Feb. 2021.
[5] C. J. J. Beckers, T. A. G. H. Geraedts, I. J. M. Besselink, and H. Nijmeijer, “TU/e Microscopic Energy Consumption PRediction tOol 0.1 (TU/e MECPRO 0.1).” 4TU.Centre for Research Data, Eindhoven, 2020.
[6] © OpenStreetMap contributors, “OpenStreetMap.” [Online]. Available: https://www.openstreetmap.org/copyright.
[7] T. G. Farr et al., “The Shuttle Radar Topography Mission,” Rev. Geophys., vol. 45, no. 2, p. RG2004, May 2007.
[8] OpenWeather ®, “OpenWeatherMap.” [Online]. Available: https://openweathermap.org/current.